The adage ‘work smarter, not harder’ often comes to mind when composing documents. Thankfully, scripting can help save the day!.
Charts in Adobe InDesign are usually produced as separate files and placed in an InDesign document as images. These charts can be high-quality PDF or EPS files, but more often than not they are medium- to low-quality bitmaps.

Many charts are also repetitive. For example, a financial data sheet that’s published every day or every week can contain one or more charts that are always the same apart from the height of bars (in a bar chart) or the way a line is drawn (in a line chart).
For this kind of publication, it’s possible to design a workflow that includes a chart template that contains all elements (the chart area, any grid lines, the X- and Y-axis labels, etc.). A data set then informs a script to change the bar heights, line shape, or to create a line from scratch. The choice between changing an existing line or creating a new one is informed by the number of data points, as you’ll see below.
It’s important to note that ‘repetitive’ is key here—there’s no point automating the creation of one-off charts since that just moves the workload from one point to another. One-off charts are best created manually in InDesign or as a separate PDF file and placed in InDesign in the usual way.
Here, we consider charts that are changed or created many times—lending themselves to automation—and we’ll consider just two chart types: bar and line. For both chart types, we’ll show how to set up a chart template and how to integrate it into a workflow.
Automating bar charts in InDesign
Bar charts are the easiest to handle, both the creation of the template and the script to change the bars. The organisation of the template is very important. Charts usually contain many elements, and we need to be able to find them easily in case there are any design changes. Importantly, a script must be able to find whatever part of the chart that needs changing.
Set up the chart template
The following figure shows the setup of the chart template used to illustrate a workflow. It’s a graph with a bar for each month of the year.
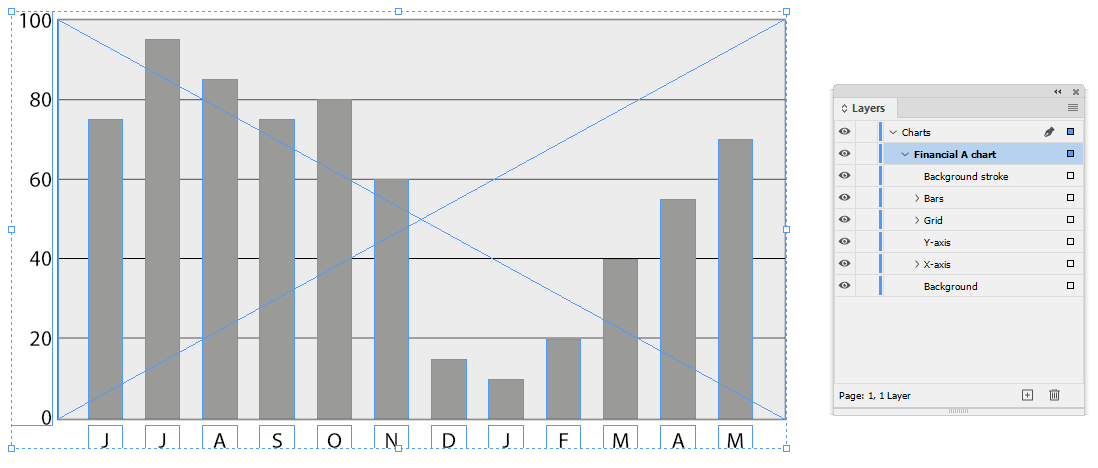
Figure 1: Example of a bar chart template
The document contains a layer ‘Charts’, which is used for all charts in this document. All the elements that make up a chart are grouped (‘Financial A chart’). This way, you can have more than one chart in the template. The chart’s name will be used to establish a link with a data set, as you’ll see later.
Provide the data set
The data set can be provided in several ways. One possibility is to use an external text file that the chart script reads. Another option, which we think is easier to handle, and which we’ll use here, is to add the data to the document. The following figure shows the chart template along with a text frame containing the data.
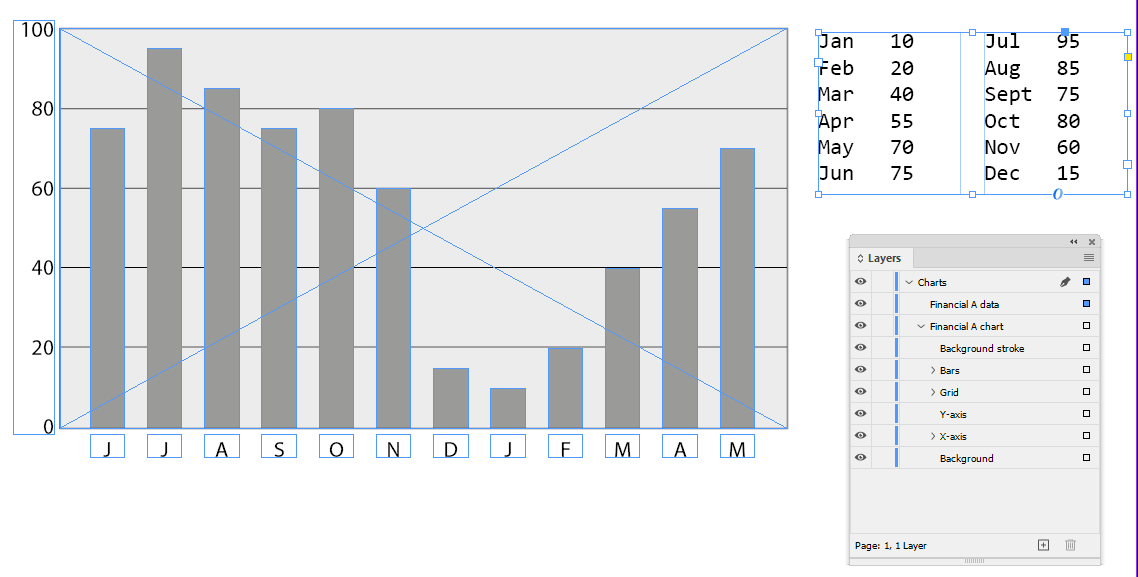
Figure 2: The bar chart template with data contained in a text frame
Run the script
A script to update a bar chart reads the content of the data frame and resizes the bars. It sets the height of each bar relative to the height of the Y-axis by reading the highest value in the Y-axis (in our example that’s 100) and dividing it by the height of the Y-axis frame. This returns the scaling factor for the bars. Thus, when the maximum value is 100 and the height of the frame is 200 points, the values from the data frame should be multiplied by two.
Because the bars are sized relative to the Y-axis, you can vary the height of the chart before the script is run by placing a copy of the template chart and resizing the background, stroke, and grid lines. The script will take the different height into account.
The script also changes the labels on the X-axis. This means that this set-up can be used each month to show data for the previous twelve months—the bars are labelled and resized in the order given in the data frame. The following video clip shows this:
Figure 3: Video showing the bar chart script running (video has no sound)
In the above example, the script leaves the data frame for clarity. If you want to be able to inspect the data afterwards, leave the frame on the pasteboard or add it to a non-printing layer, otherwise let the script remove the text frame.
Organising the workflow
Workflows can be organised in several ways. If using InDesign Desktop, in a single-page document, place the chart template where the chart should appear and then place the data frame anywhere on the page. Then you run the script from InDesign’s Scripts panel, as shown in the clip above.
In automated workflows, one approach is to place the chart template on a parent page and place the data frame in the source text, sizing it to the dimension of the chart template. A script then looks for data frames on document pages, finds the corresponding chart template, copies it to the place where the data frame is, and then updates the copy. All this is possible because a script can match chart templates and data frames via their names on the InDesign’s Layers panel.
Automating line charts in InDesign
In principle, a line chart is similar to a bar chart in that the line’s inflection points correspond to the top centres of the bars. However, the line in a line-chart template is much trickier to add than several bars, and especially if the line has many values on the X-axis, it’s not feasible to add it to the template. Instead, the script that updates the line chart will draw the graph.
The chart template, together with the data, looks as follows:
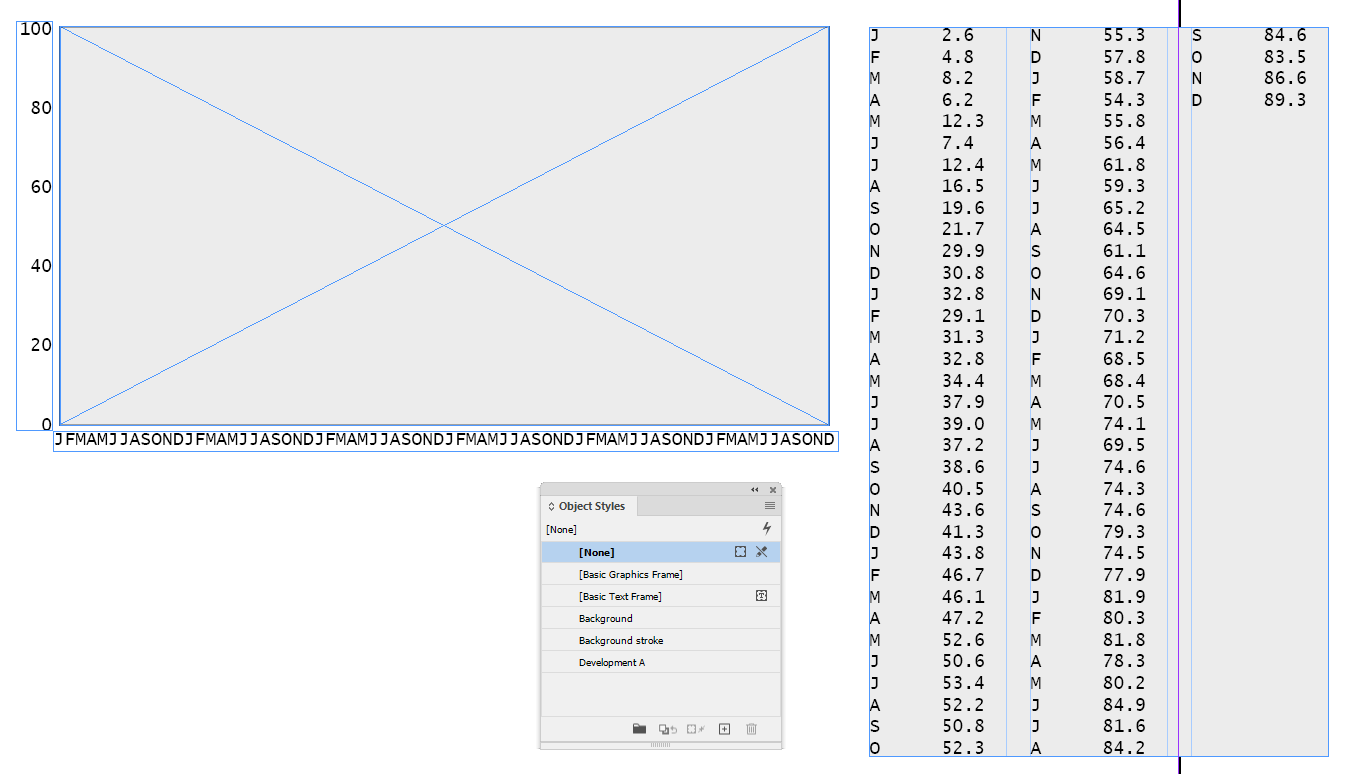
Figure 4: Setting up a line chart in InDesign with Object Styles applied
The set-up is like the one used for the bar chart. However, because the script draws the line, it should have an object style applied to it so that the user can determine the appearance of the line. In the above example, the object style’s name (‘Development A’) is such that it can be derived from the chart’s name.
Figure 5: Video showing the line chart script running (video has no sound)
Workflow considerations for this script are the same as for the bar chart discussed earlier.
Automate repetitive charts and save time with scripting
InDesign’s drawing tools and its phenomenal scriptability make it possible to create various types of chart on the fly. While we covered just two chart types in this post, various other chart types can be automated as well, such as mountain charts and pie charts. If you can harness the power of scripting automation, you can speed up the production of documents that use charts enormously!
This article first appeared on the BookMachine Production & Operations blog.
Want to save time, effort and money with InDesign scripting? Join Peter in our recorded webinar series on scripting for Typefi users.

Peter Kahrel
Senior Scripting Engineer | Spain
Peter has been programming InDesign with JavaScript since 2003, mainly to cut out the tedium that faces every typesetter and indexer but in equal measure because it’s good fun. Peter has worked as a script developer at Typefi since 2010, and is highly regarded in the global InDesign scripting community.